手把手式小白入门prometheus与grafana监控系统搭建
整体架构
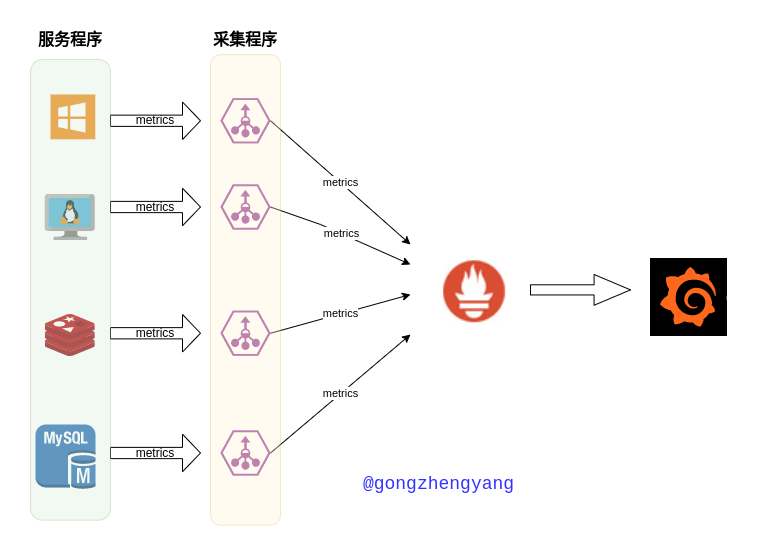
采集与监控流程
- 存在一个具体的主机或者服务,存在一些可以被采集的指标,比如
linux系统上面的CPU内存等指标 - 部署了对应服务或主机的采集程序
Exporter,该程序同时提供一个对外暴露的http接口用于提供采集到的数据,通常是开放一个http://{host}:{port}/metrics接口 Prometheus负责定期数据收集,存储以及对外提供查询服务grafana提供监控数据可视化面板(dashboard),用于监控数据精美展示
docker服务配置
新建compose.yaml如下
services:
  prometheus:
    image: prom/prometheus:latest
    container_name: demo-prometheus
    restart: unless-stopped
    ports:
      - "9090:9090"
    volumes:
      - ./prometheus.yml:/etc/prometheus/prometheus.yml
      - prometheus-data:/prometheus
    networks:
      - demo

  grafana:
    image: grafana/grafana-enterprise:latest
    container_name: demo-grafana
    restart: unless-stopped
    ports:
      - "3000:3000"
    volumes:
      - grafana-data:/var/lib/grafana
      - grafana-config:/etc/grafana
    networks:
      - demo

  node-exporter:
    image: quay.io/prometheus/node-exporter:latest
    container_name: demo-node-exporter
    command:
      - '--path.rootfs=/host'
    network_mode: host
    pid: host
    restart: unless-stopped
    volumes:
      - '/:/host:ro,rslave'

networks:
  demo:
    name: "demo"
    external: false

volumes:
  grafana-data: {}
  grafana-config: {}
prometheus-data: {}services:
prometheus:
image: prom/prometheus:latest
container_name: demo-prometheus
restart: unless-stopped
ports:
- "9090:9090"
volumes:
- ./prometheus.yml:/etc/prometheus/prometheus.yml
- prometheus-data:/prometheus
networks:
- demo
grafana:
image: grafana/grafana-enterprise:latest
container_name: demo-grafana
restart: unless-stopped
ports:
- "3000:3000"
volumes:
- grafana-data:/var/lib/grafana
- grafana-config:/etc/grafana
networks:
- demo
node-exporter:
image: quay.io/prometheus/node-exporter:latest
container_name: demo-node-exporter
command:
- '--path.rootfs=/host'
network_mode: host
pid: host
restart: unless-stopped
volumes:
- '/:/host:ro,rslave'
networks:
demo:
name: "demo"
external: false
volumes:
grafana-data: {}
grafana-config: {}
prometheus-data: {}提供三个服务
prometheus服务,用于收集metrics数据默认开放
9090端口./prometheus.yml:/etc/prometheus/prometheus.yml:需要外部挂载一个配置文件到容器指定位置,用于定义采集服务的信息等(该文件后面会详细解释)prometheus-data:/prometheus: 需要把保存的数据挂载出来,以免容器再次启动时数据丢失通过执行如下命令可以大致知道数据卷位置,可以看到镜像定义的
volumes的参数只有/prometheus,启动命令中也看不到有别的什么需要持久化的数据路径,剩下的
/etc/prometheus/,/usr/share/prometheus/可以在查看后自行决定是否挂载shell$ docker image inspect prom/prometheus:latest ... "Cmd": [ "--config.file=/etc/prometheus/prometheus.yml", "--storage.tsdb.path=/prometheus", "--web.console.libraries=/usr/share/prometheus/console_libraries", "--web.console.templates=/usr/share/prometheus/consoles" ], "Image": "sha256:c306a8110e4d13dbe51ddeb37b0746b6238819256a338d1cc5d226e04b02a06a", "Volumes": { "/prometheus": {} },$ docker image inspect prom/prometheus:latest ... "Cmd": [ "--config.file=/etc/prometheus/prometheus.yml", "--storage.tsdb.path=/prometheus", "--web.console.libraries=/usr/share/prometheus/console_libraries", "--web.console.templates=/usr/share/prometheus/consoles" ], "Image": "sha256:c306a8110e4d13dbe51ddeb37b0746b6238819256a338d1cc5d226e04b02a06a", "Volumes": { "/prometheus": {} },
grafana服务默认开放端口
3000volumes参数:查看容器信息如下,发现路径较多,所以目前只挂载
/var/lib/grafana以及/etc/grafanashell$ docker image inspect grafana/grafana-enterprise ... "Env": [ "GF_PATHS_CONFIG=/etc/grafana/grafana.ini", "GF_PATHS_DATA=/var/lib/grafana", "GF_PATHS_HOME=/usr/share/grafana", "GF_PATHS_LOGS=/var/log/grafana", "GF_PATHS_PLUGINS=/var/lib/grafana/plugins", "GF_PATHS_PROVISIONING=/etc/grafana/provisioning" ], "Cmd": null, "Image": "", "Volumes": null,$ docker image inspect grafana/grafana-enterprise ... "Env": [ "GF_PATHS_CONFIG=/etc/grafana/grafana.ini", "GF_PATHS_DATA=/var/lib/grafana", "GF_PATHS_HOME=/usr/share/grafana", "GF_PATHS_LOGS=/var/log/grafana", "GF_PATHS_PLUGINS=/var/lib/grafana/plugins", "GF_PATHS_PROVISIONING=/etc/grafana/provisioning" ], "Cmd": null, "Image": "", "Volumes": null,
node-exporter作为采集程序(prometheus组织官方提供专门用于采集主机服务指标的程序,可以采集CPU,内存,磁盘,网卡等性能数据)网络模式使用
host模式以便获取到宿主机真实网卡信息pid配置为host与宿主机使用相同的pid命名空间,这样可以获取到宿主机所有程序信息以只读方式挂载系统根目录到容器当中,用于获取系统磁盘数据,否则容器内部获取的是容器内部磁盘信息导致数据错误
服务默认开放端口9100,服务启动后浏览器访问地址
http://127.0.0.1:9100/metrics查看该服务采集到的系统数据metrics提供的数据形式如下第一行是
# HELP开头,用于解释当前指标的含义第二行是
# TYPE开头,说明当前指标的数据类型剩下的就是具体采集到的数据
# HELP node_cooling_device_cur_state Current throttle state of the cooling device
# TYPE node_cooling_device_cur_state gauge
node_cooling_device_cur_state{name="0",type="Processor"} 0
node_cooling_device_cur_state{name="1",type="Processor"} 0
node_cooling_device_cur_state{name="10",type="Processor"} 0
node_cooling_device_cur_state{name="11",type="Processor"} 0
node_cooling_device_cur_state{name="12",type="intel_powerclamp"}
# HELP node_cooling_device_cur_state Current throttle state of the cooling device # TYPE node_cooling_device_cur_state gauge node_cooling_device_cur_state{name="0",type="Processor"} 0 node_cooling_device_cur_state{name="1",type="Processor"} 0 node_cooling_device_cur_state{name="10",type="Processor"} 0 node_cooling_device_cur_state{name="11",type="Processor"} 0 node_cooling_device_cur_state{name="12",type="intel_powerclamp"}
prometheus采集配置
与上面的compose.yaml文件相同目录下,新建prometheus.yml文件,该文件会被挂载到prometheus容器当中
global:
  # 配置全局默认收集metrics间隔
  scrape_interval: 15s
  # 当与外部系统通信的时候,会把该配置下的`label`信息附加到数据中
  external_labels:
    monitor: 'codelab-monitor'

# 收集数据的配置
scrape_configs:
	# 定义收集job名称,此处采集prometheus自己本身的metrics
  - job_name: 'prometheus'
    # 收集间隔会覆盖上面的全局配置
    scrape_interval: 5s
    # 配置采集的http的接口位置,这个地方只需要填写IP和端口即可
    # 采集的时候prometheus会加上url路径访问http://localhost:9090/metrics获取数据
    static_configs:
      - targets: ['localhost:9090']

  - job_name: 'host-node'
    static_configs:
- targets: ['172.17.0.1:9100']global:
# 配置全局默认收集metrics间隔
scrape_interval: 15s
# 当与外部系统通信的时候,会把该配置下的`label`信息附加到数据中
external_labels:
monitor: 'codelab-monitor'
# 收集数据的配置
scrape_configs:
# 定义收集job名称,此处采集prometheus自己本身的metrics
- job_name: 'prometheus'
# 收集间隔会覆盖上面的全局配置
scrape_interval: 5s
# 配置采集的http的接口位置,这个地方只需要填写IP和端口即可
# 采集的时候prometheus会加上url路径访问http://localhost:9090/metrics获取数据
static_configs:
- targets: ['localhost:9090']
- job_name: 'host-node'
static_configs:
- targets: ['172.17.0.1:9100']host-node解释
该采集程序是由
compose.yaml文件中配置的服务node-exporter提供的,开放9100端口由于其处于
host宿主机网络命名空间,而prometheus处于docker内部的一个桥接网络demo网络环境中,所以不能通过127.0.0.1或者node-exporter访问到对应的node-exporter采集程序,所以targets参数需要填写docker0的IP来表示宿主机网络空间下的prometheus查看
docker0的IP如下,一般在linux上安装docker之后,默认docker0网卡的IP是固定的172.17.0.1,其他操作系统或环境可能是别的IP,此处配置需要具体留意,按照实际的IP地址修改shell$ ip addr show docker0 14: docker0: <NO-CARRIER,BROADCAST,MULTICAST,UP> mtu 1500 qdisc noqueue state DOWN group default link/ether 02:42:49:57:88:25 brd ff:ff:ff:ff:ff:ff inet 172.17.0.1/16 brd 172.17.255.255 scope global docker0 valid_lft forever preferred_lft forever$ ip addr show docker0 14: docker0: <NO-CARRIER,BROADCAST,MULTICAST,UP> mtu 1500 qdisc noqueue state DOWN group default link/ether 02:42:49:57:88:25 brd ff:ff:ff:ff:ff:ff inet 172.17.0.1/16 brd 172.17.255.255 scope global docker0 valid_lft forever preferred_lft forever
服务启动
$ docker compose up -d
[+] Running 7/7
 ⠿ Network demo                   Created          0.1s
 ⠿ Volume "prom_prometheus-data"  Created          0.0s
 ⠿ Volume "prom_grafana-data"     Created          0.0s
 ⠿ Volume "prom_grafana-config"   Created          0.0s
 ⠿ Container demo-grafana         Started          0.5s
 ⠿ Container demo-node-exporter   Started          0.2s
 ⠿ Container demo-prometheus      Started          0.4s
$ docker compose up -d
[+] Running 7/7
⠿ Network demo Created 0.1s
⠿ Volume "prom_prometheus-data" Created 0.0s
⠿ Volume "prom_grafana-data" Created 0.0s
⠿ Volume "prom_grafana-config" Created 0.0s
⠿ Container demo-grafana Started 0.5s
⠿ Container demo-node-exporter Started 0.2s
⠿ Container demo-prometheus Started 0.4s检查docker网络命名空间
$ docker network ls
NETWORK ID     NAME     DRIVER    SCOPE
61ff0fdec0df   demo     bridge    local
0812cab7929c   host     host      local
....
$ docker network ls
NETWORK ID NAME DRIVER SCOPE
61ff0fdec0df demo bridge local
0812cab7929c host host local
....检查demo网络命名空间里面的容器
$ docker network inspect demo
[
    {
        "Name": "demo",
        ....
        "Containers": {
            "774dd4e703f541872b5ed513996020c4e2239694663df62b50c5c83451938368": {
                "Name": "demo-grafana",
                "EndpointID": "73c2c67e833446363cdde52b2536d9981ca6b813342638697616bfce42bc1e6f",
                "MacAddress": "02:42:c0:a8:a0:02",
                "IPv4Address": "192.168.160.2/20",
                "IPv6Address": ""
            },
            "ed204573a64bc2601f4310cb5dbfe4952ac1c2b310a218ced63b578ff6ef49dc": {
                "Name": "demo-prometheus",
                "EndpointID": "f8e4f5c42ccfdd2387f9a76392f3e6bbcbba1efe850a8392fdcbf47cafe29a09",
                "MacAddress": "02:42:c0:a8:a0:03",
                "IPv4Address": "192.168.160.3/20",
                "IPv6Address": ""
            }
        },
        ....
]
$ docker network inspect demo
[
{
"Name": "demo",
....
"Containers": {
"774dd4e703f541872b5ed513996020c4e2239694663df62b50c5c83451938368": {
"Name": "demo-grafana",
"EndpointID": "73c2c67e833446363cdde52b2536d9981ca6b813342638697616bfce42bc1e6f",
"MacAddress": "02:42:c0:a8:a0:02",
"IPv4Address": "192.168.160.2/20",
"IPv6Address": ""
},
"ed204573a64bc2601f4310cb5dbfe4952ac1c2b310a218ced63b578ff6ef49dc": {
"Name": "demo-prometheus",
"EndpointID": "f8e4f5c42ccfdd2387f9a76392f3e6bbcbba1efe850a8392fdcbf47cafe29a09",
"MacAddress": "02:42:c0:a8:a0:03",
"IPv4Address": "192.168.160.3/20",
"IPv6Address": ""
}
},
....
]检查docker host网络命名空间的容器
$ docker network inspect host
[
    {
        "Name": "host",
        ...
        "Containers": {
            "bde02aced39fd6bfc6017647b05d187d1eb94b5f7155cb026bead1cbc9038d19": {
                "Name": "demo-node-exporter",
                "EndpointID": "07d90ac1f8ebc897035c0cfde1b54210c85c442ea2125625c4f32090e3e28700",
                "MacAddress": "",
                "IPv4Address": "",
                "IPv6Address": ""
            }
        },
        ...
    }
]
$ docker network inspect host
[
{
"Name": "host",
...
"Containers": {
"bde02aced39fd6bfc6017647b05d187d1eb94b5f7155cb026bead1cbc9038d19": {
"Name": "demo-node-exporter",
"EndpointID": "07d90ac1f8ebc897035c0cfde1b54210c85c442ea2125625c4f32090e3e28700",
"MacAddress": "",
"IPv4Address": "",
"IPv6Address": ""
}
},
...
}
]采集程序服务验证
prometheus服务自带采集程序,浏览器访问地址http://localhost:9090/metrics查看是否返回数据node-exporter开放端口9100,浏览器访问地址http://localhost:9100/metrics查看是否返回数据
grafana增加dasboard
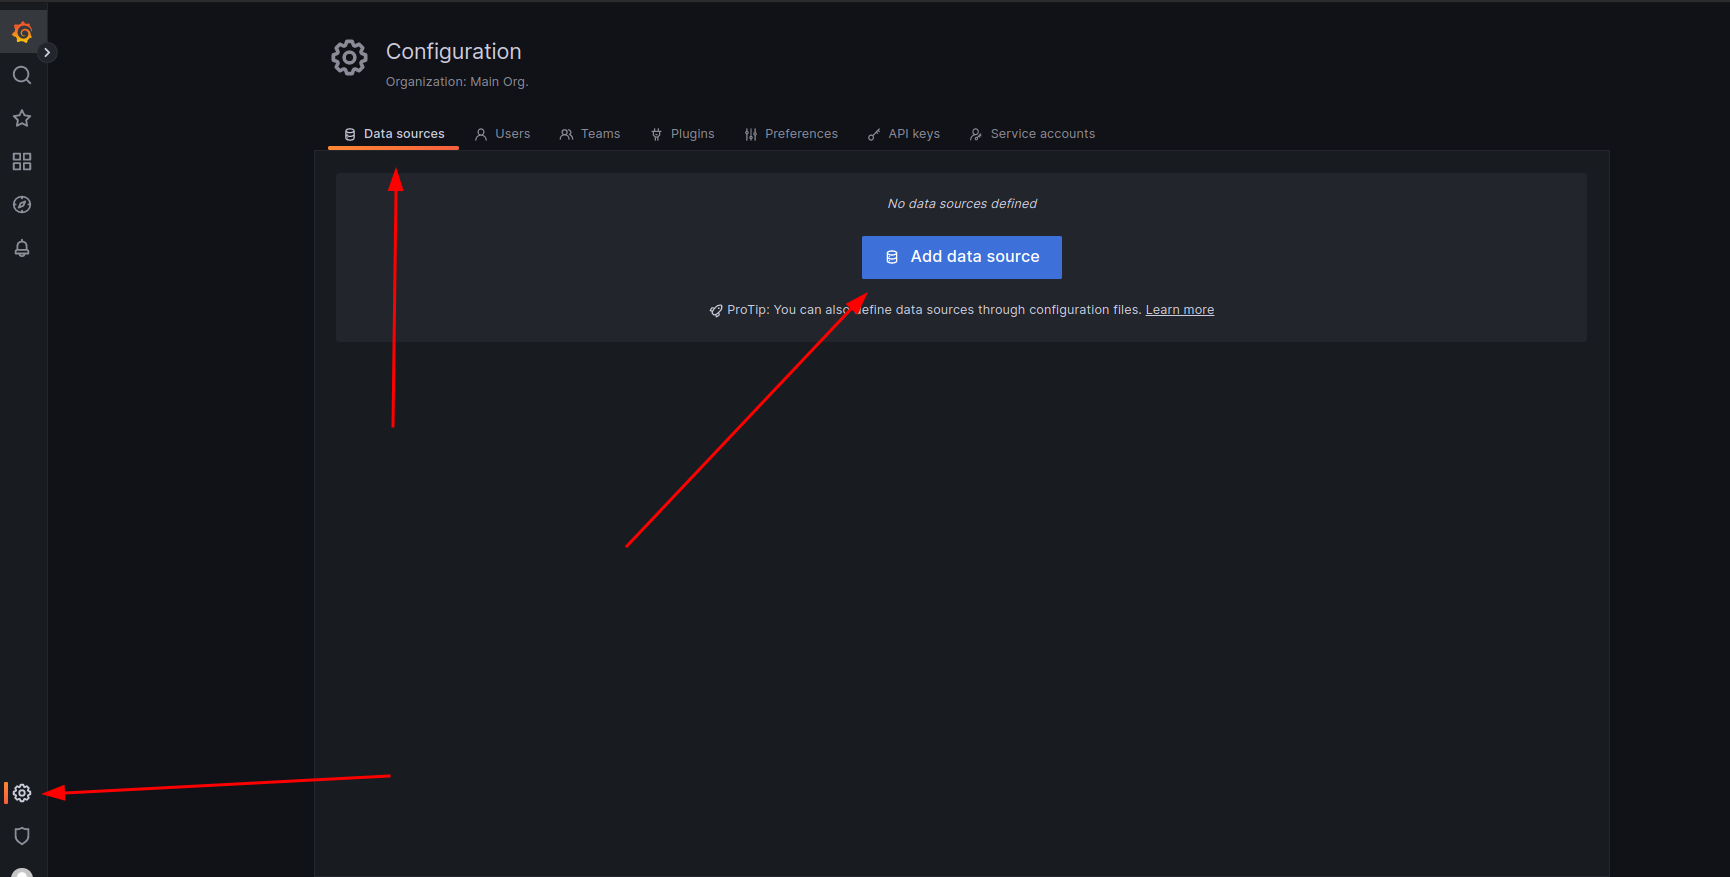
访问http://localhost:3000/进入到grafana登录页面,输入账号密码admin/admin登录
导航到Configuration/Data Sources,新增一个data source,点击Add data source按钮之后在弹出的列表当中选择Prometheus
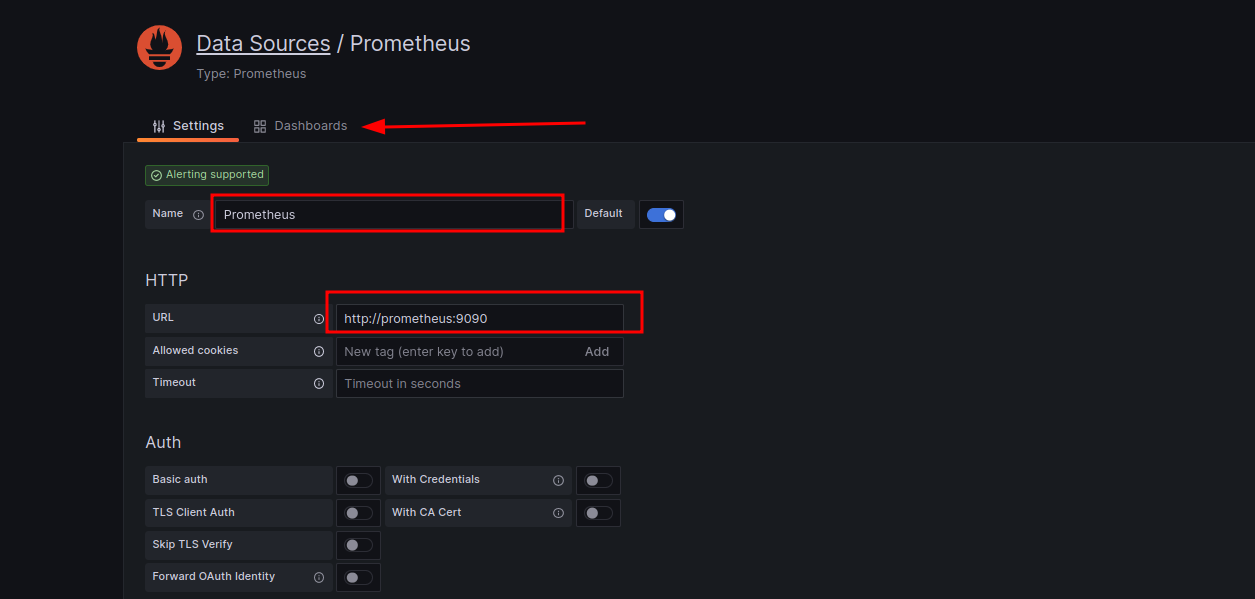
填写基本的名称参数以及Prometheus的地址
由于grafana以及prometheus都处于docker的demo网络环境中,所以在填写prometheus的IP地址时需要直接填写prometheus进行访问
填写完成之后点击最下面的Save & test按钮
最后点击Dashboards配置图表,发现有三个默认的图表,直接点击import即可
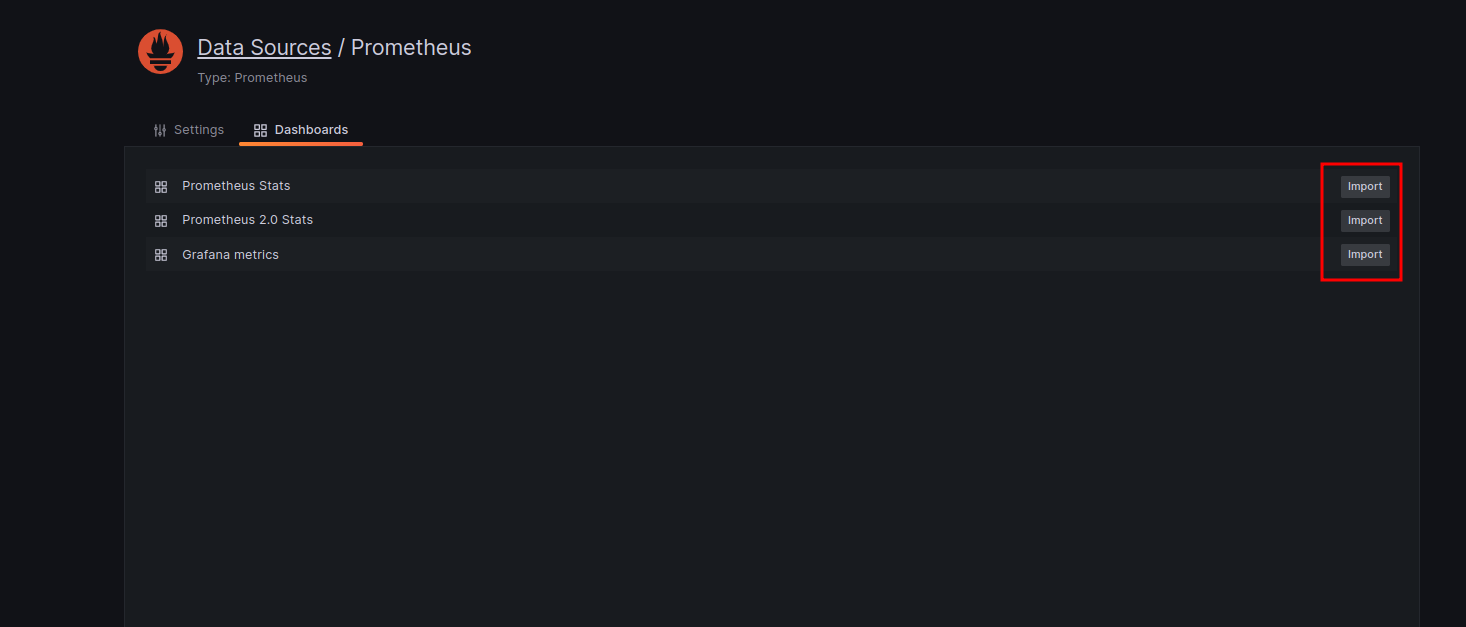
最后保存退出,去访问Dashboards/Browse查看图表
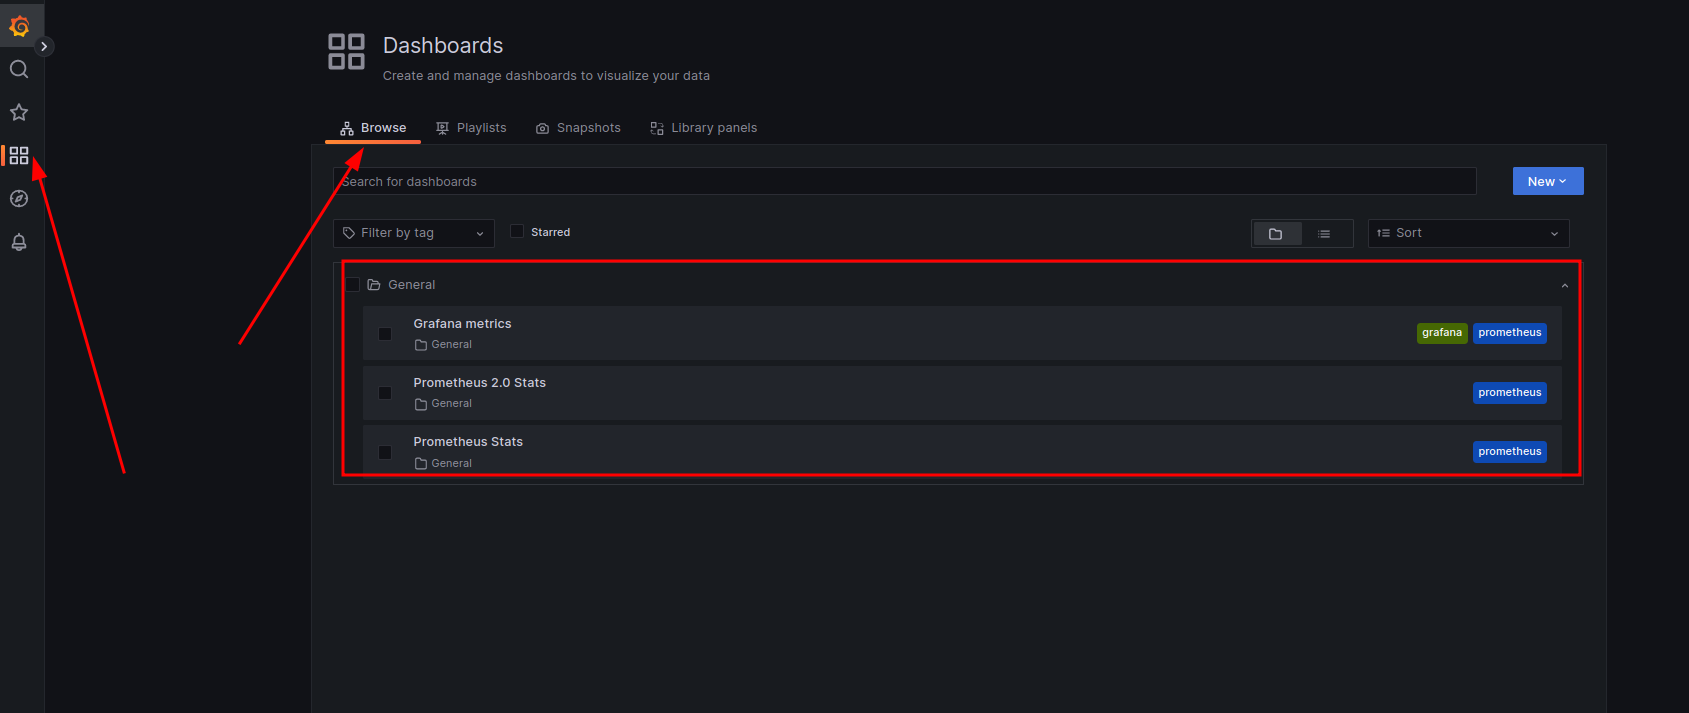
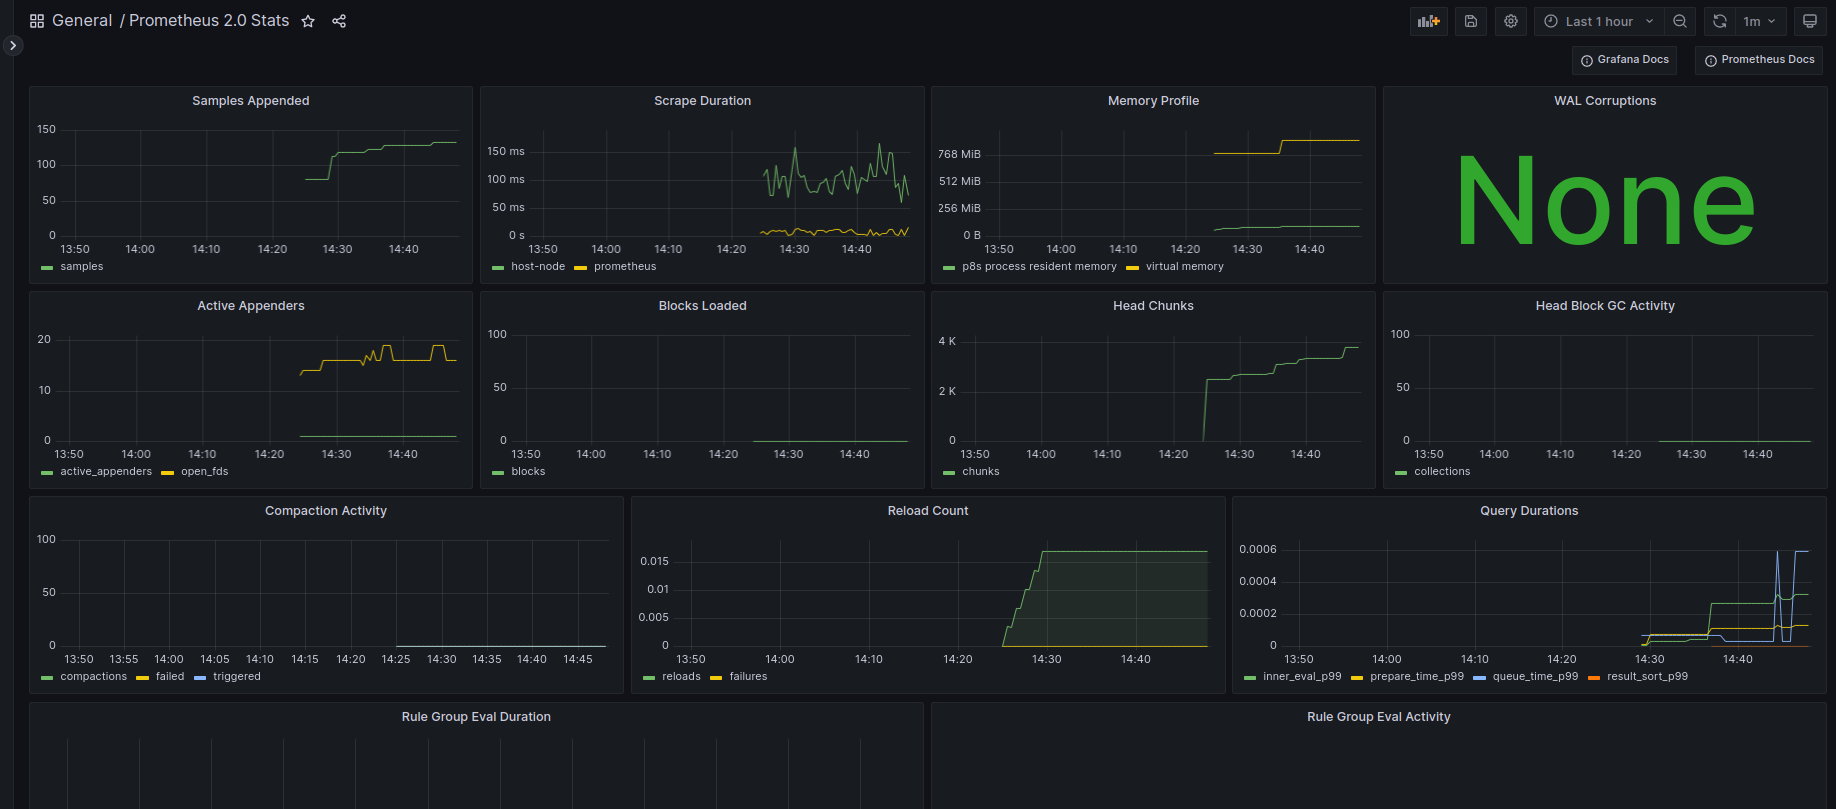
目前由于Grafana metrics没有被包含到prometheus的采集配置yml文件中,所以该图表是没有数据的,现在可以点击Prometheus 2.0 stats查看图表
grafana增加node exporter的dashboard
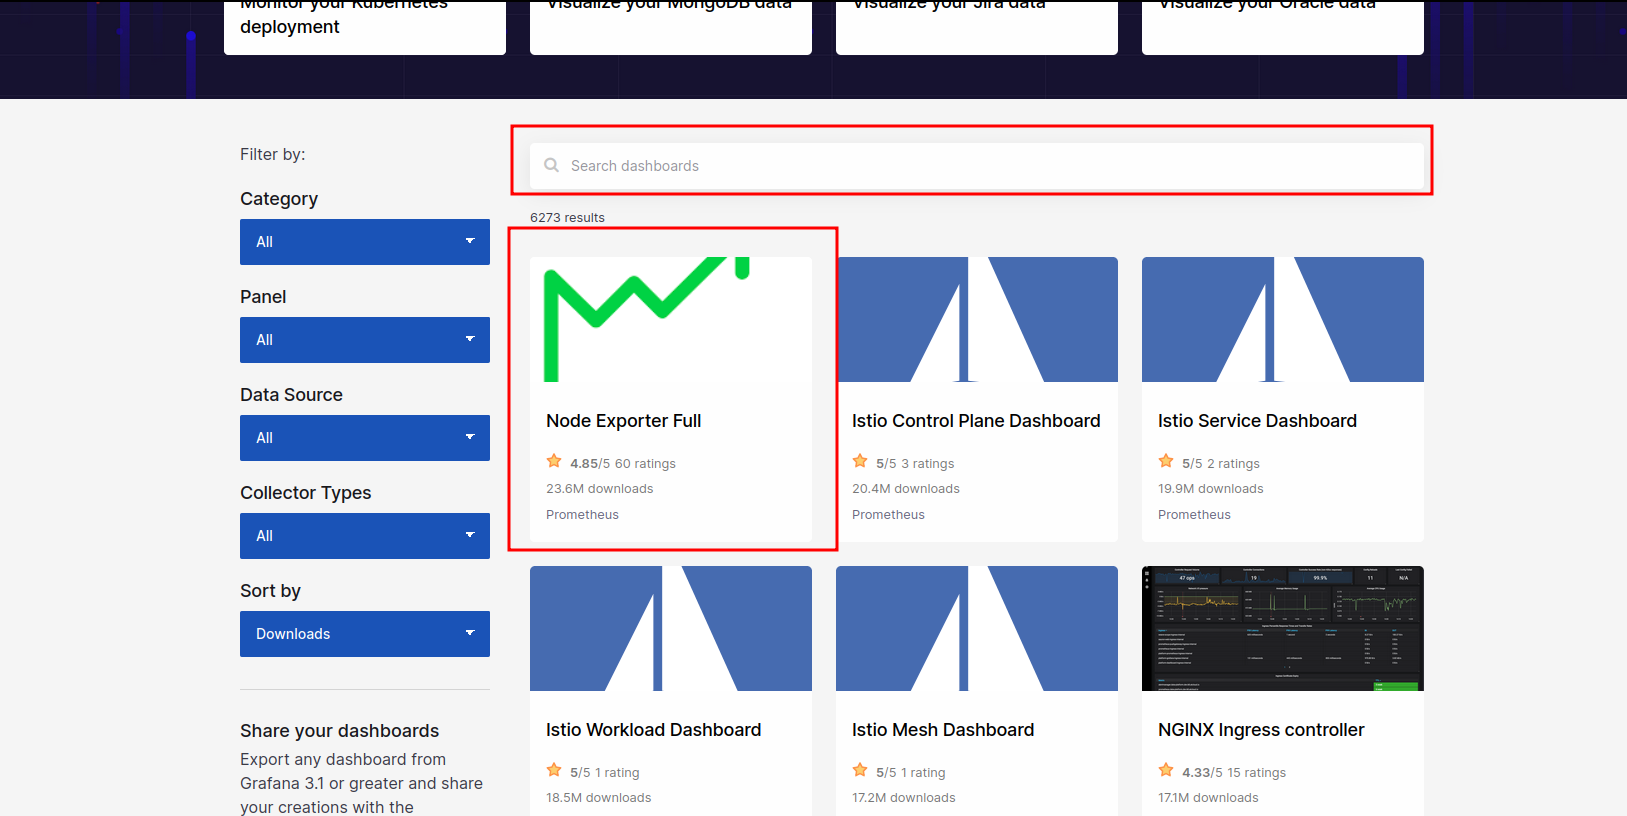
首先去访问grafana的dashborads库https://grafana.com/grafana/dashboards/获取一个node exporter的配置json文件
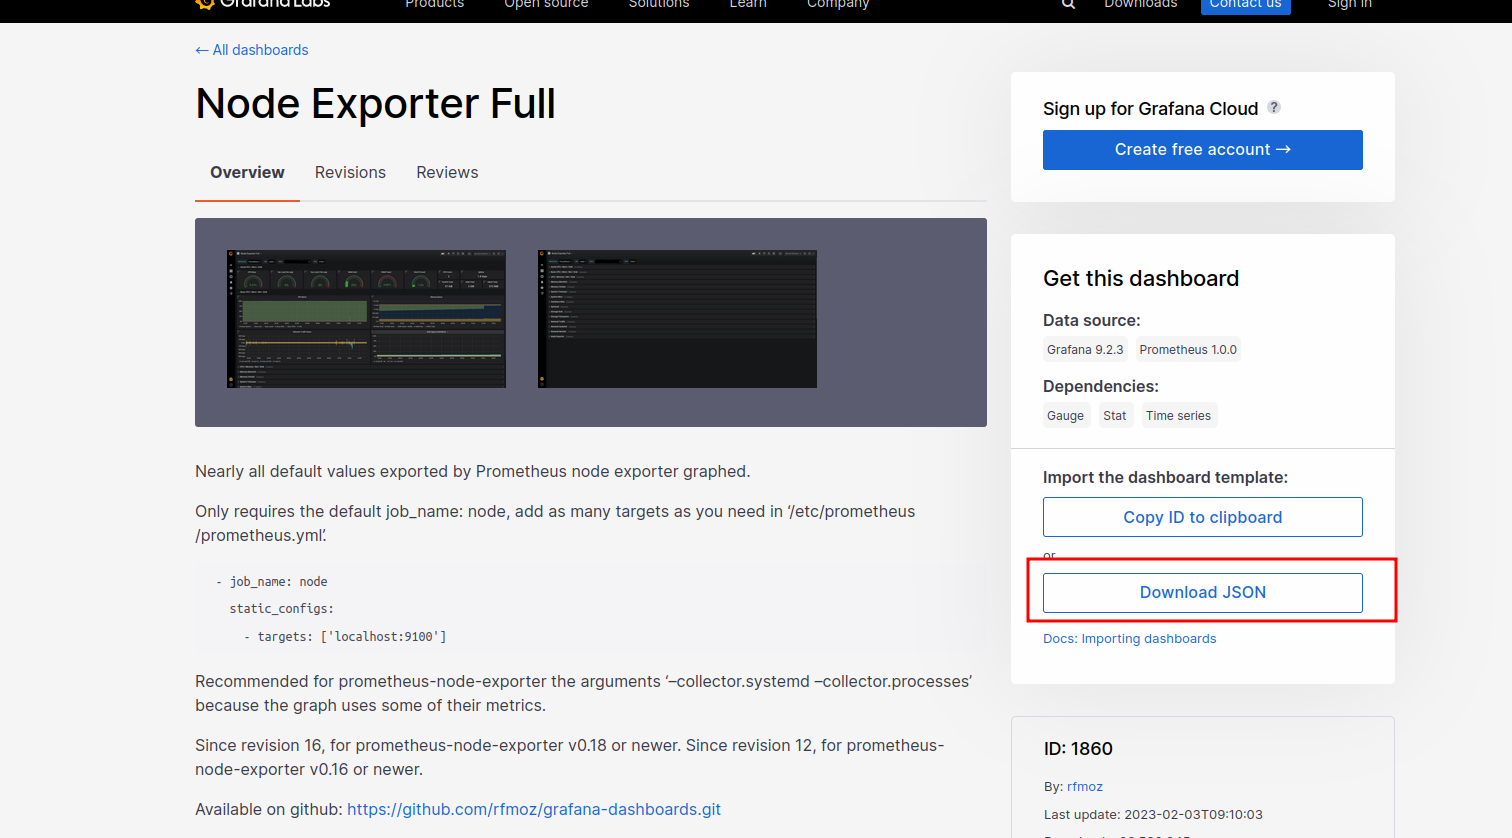
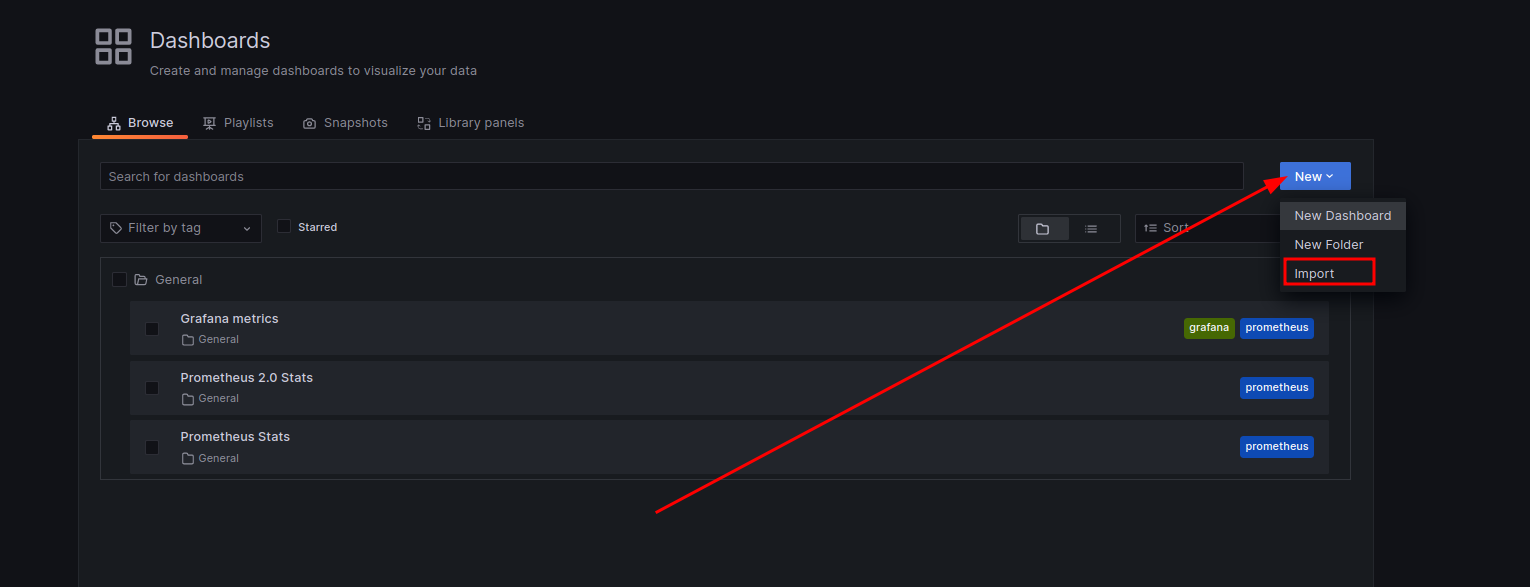
之后回到grafana的页面点击Import按钮,在弹出的新页面中导入下载的json,可以直接上传json或者拖动json文件到页面
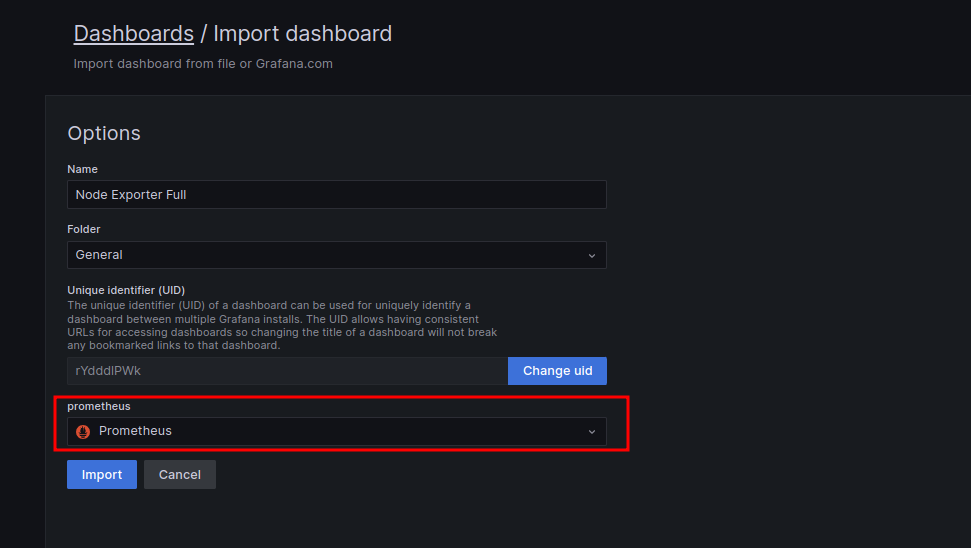
最后配置选择数据源Prometheus,配置完成之后点击Import按钮
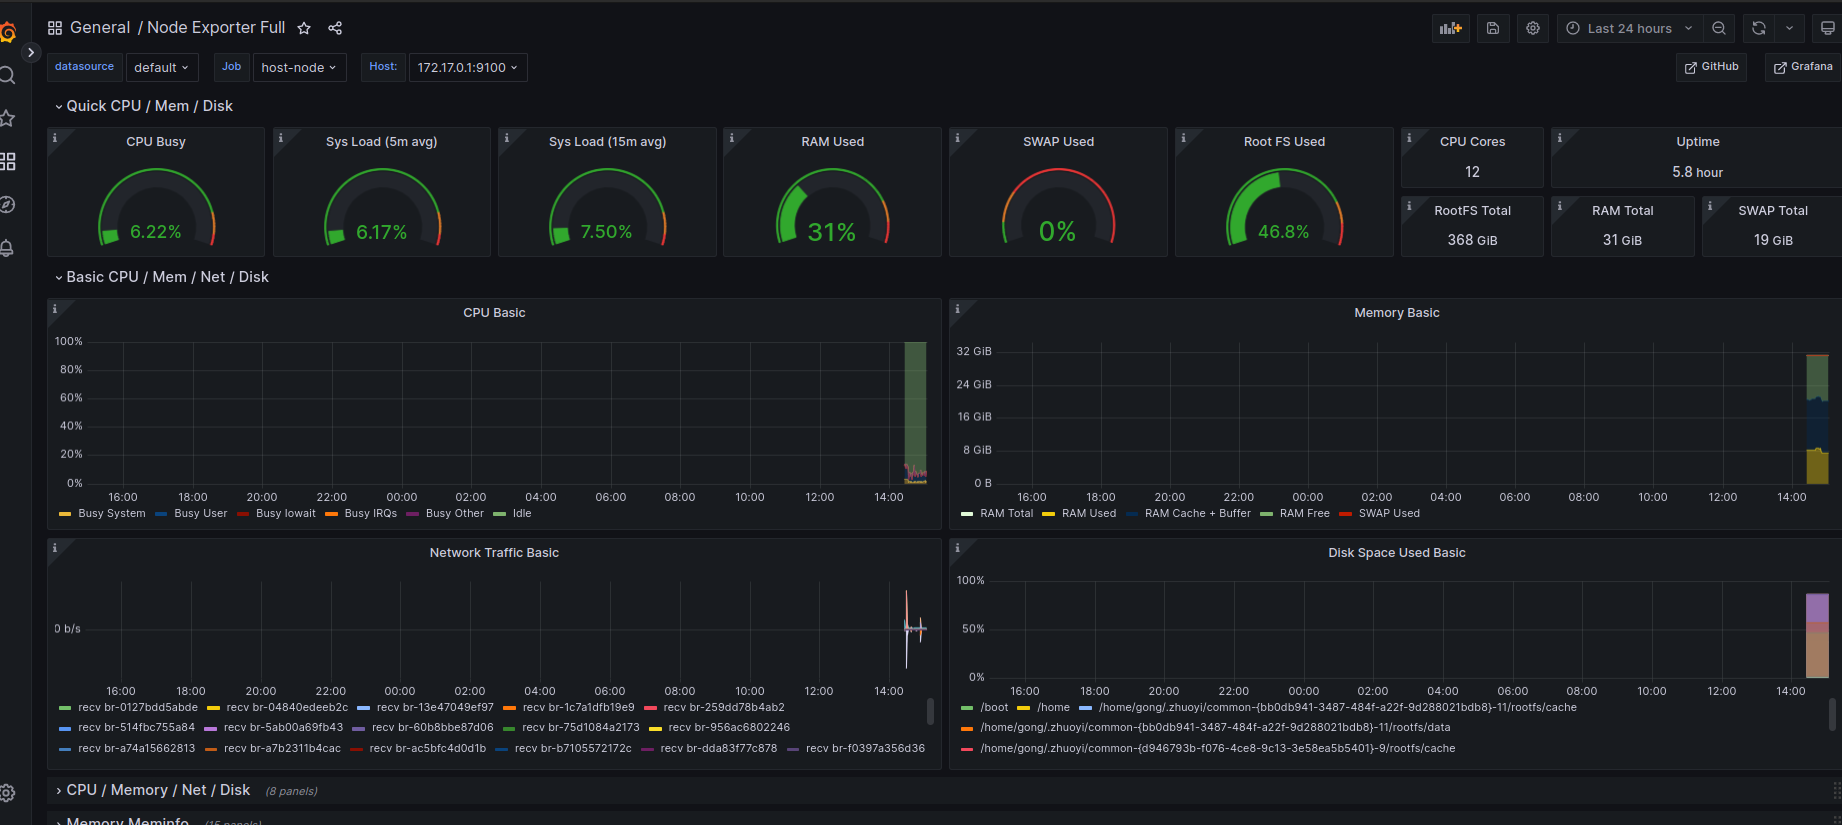
最后Dashboard的列表页面就新增完成了Node Exporter Full的选项,点击进去就看到了node exporter的数据图表
至此,服务启动与基本配置完成
参考阅读
prometheus/node_exporter项目仓库readme.md